Static Map Preview - Click for full interactive map →
This post presents a practical Python workflow for tracking offshore drilling activity in the U.S. Gulf of Mexico (GoM) using publicly available BSEE Application for Permit to Drill (APD) data. It demonstrates how to download the GoM wells permit data, visualize recent approvals on an interactive rig-tracking map with Plotly, and generate operator- and rig-level summary tables relevant to offshore drilling and MPD planning.
This post presents a practical Python workflow for tracking offshore drilling activity in the U.S. Gulf of Mexico (GoM) using publicly available BSEE Application for Permit to Drill (APD) data. It demonstrates how to download the GoM wells permit data, visualize recent approvals on an interactive rig-tracking map with Plotly, and generate operator- and rig-level summary tables relevant to offshore drilling and MPD planning. Moreover, it details an extensive exploratory data analysis of the BSEE APD database, with details related to drilling activity (inferred from the permit entries) for the GoM operators and rigs.
BSEE-Approved Gulf of Mexico Wells
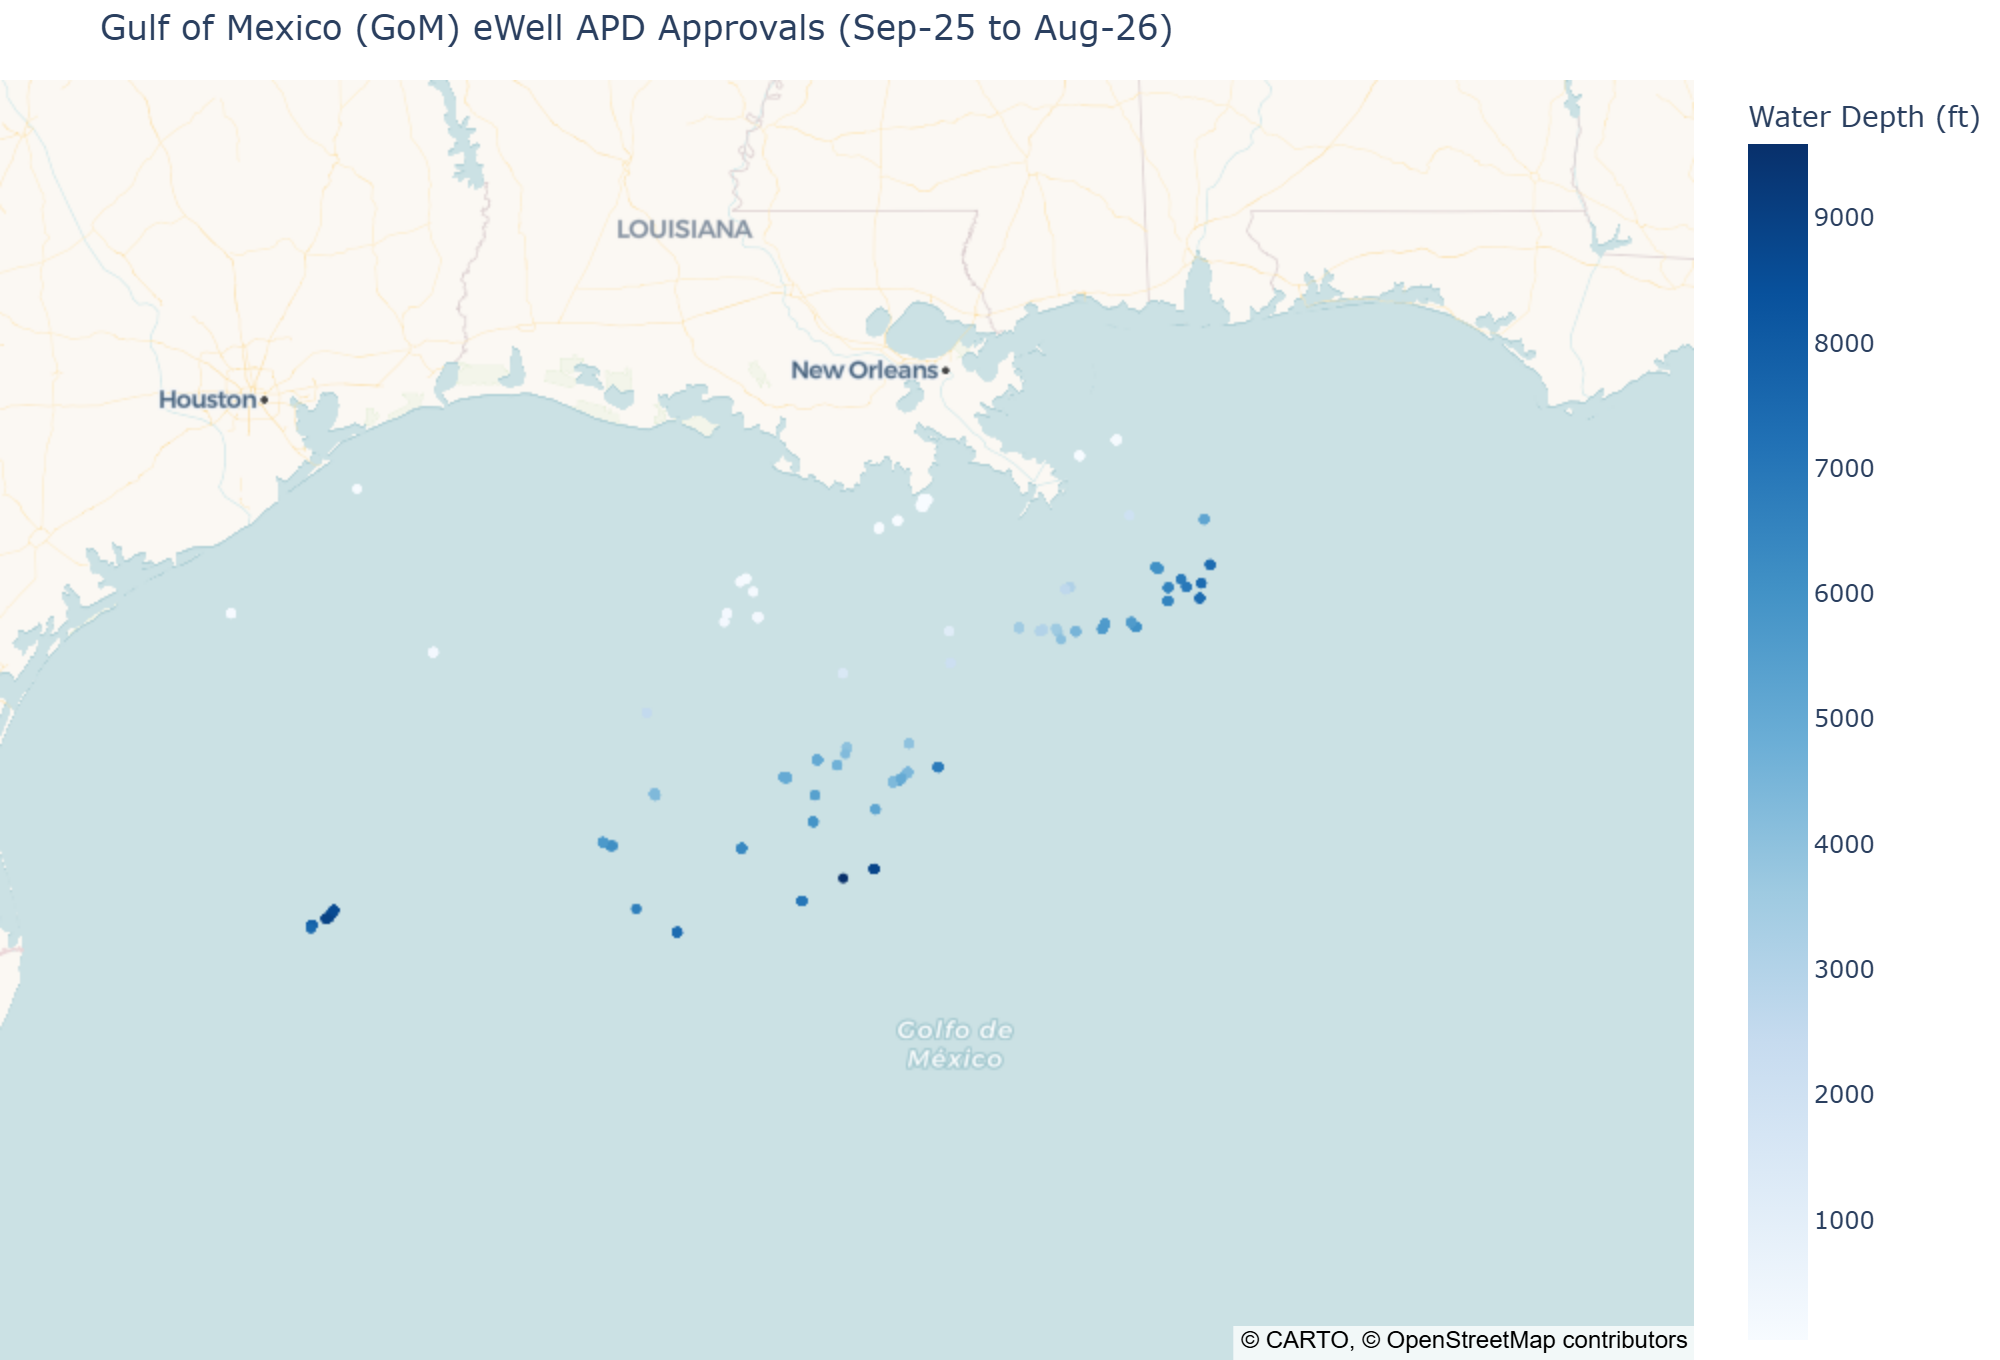
Interactive Map of eWell APD Approvals (Last 12 Months), Colored by Water Depth
Source: BSEE eWell APD database. Water depth encoded via color scale (ft). Hover for well and rig details; zoom and selection tools available in the upper-left.
Operator Activity (Unique Wells & Average Water Depth)
Unique/distinct well count by operator, including every permit type present on the dataset: 'Revised Sidetrack', 'Revised New Well', 'Revised Bypass', 'Bypass', 'Sidetrack', 'New Well'.
Rig Type Activity (Unique Rigs & Average Water Depth)
Unique/distinct rig count by rig category (`RIG_TYPE_CODE` field), with the mean declared water depth for each rig category.
Data source: BSEE eWell APD | Filtered for last 12-months approved wells in the Gulf of Mexico (GoM)
Step-by-Step to Build the GoM Rig Tracker Dashboard in Jupyter Notebooks
The notebook containing the code referenced below can be viewed and downloaded from the following links:


1. Data Acquisition from BSEE eWell APD Database
1.1 Application for Permit to Drill (APD) Dataset
The foundation of the rig tracker dashboard is the Bureau of Safety and Environmental Enforcement (BSEE) eWell Application for Permit to Drill (APD) database. This dataset provides regulatory-approved well information for offshore operations in the U.S. Gulf of Mexico, including operator, well location, water depth, rig metadata, and approval dates. These fields are particularly well suited for spatial, temporal, and operational analysis of offshore drilling activity.
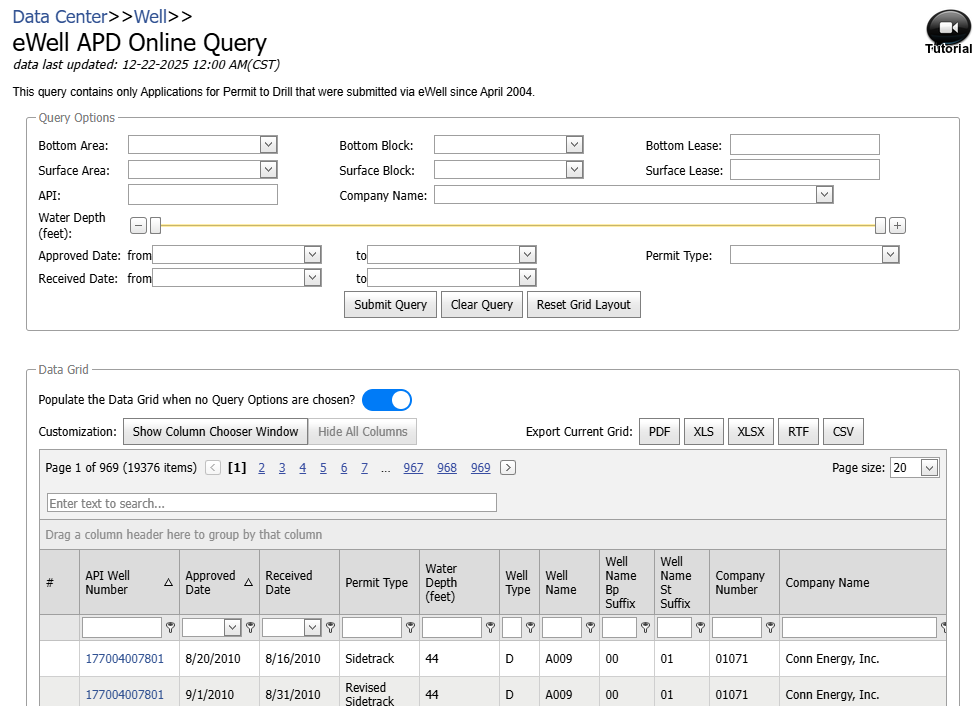 BSEE eWell APD Data Sample - Screenshot from BSEE’s eWell APD data download page
For this workflow, the APD data are downloaded directly from the BSEE’s public “Raw Data” portal in compressed format. The analysis is intentionally based on officially approved permits, ensuring regulatory consistency and avoiding uncertainty associated with speculative or announced-but-unapproved wells.
Loading notebook…
Loading notebook…
Data Source & Disclaimer
Data used in this analysis were obtained from the publicly available BSEE eWell Application for Permit to Drill (APD) database. The dataset was accessed via a bulk download and processed using custom Python workflows.
The analysis and visualizations presented here are for informational purposes only and reflect the author’s interpretation of the data. They do not represent official positions or endorsements by BSEE. Results are subject to the inherent limitations and reporting uncertainties of the source dataset.